Written By: Ryan Hickey, Kris Willems, Tod Daniels, and Hugh Leong
The great bugaboo in learning to “speak” Thai is of course the tones, in which there are five of them: mid tone, low tone, falling tone, high tone, and rising tone.
By comparing English and Thai it might help us understand how tones fit into both languages.
Both Thai and English are “tone” languages. The tones in English are on the sentence level and the tones in Thai are on the word level. A change in English tones usually adds to the meaning of a sentence. A change in Thai tones changes the meaning of a word.
We call this “the music of the language”. Just like songs, languages have words and music, and you must know them both before you can get it right.
Contents
Is Thai Tone Important?
One of the biggest mistakes learners of Thai have is not to stress the importance of Thai tones. If you get the tones wrong, no matter how much vocabulary you know, no matter how well you read and write, no matter what context you are speaking in, no one will understand a word you say.
Let me change that a bit. If you have someone you spend lots of time with friends, they may be able to “decipher” incorrect tones and “guess” what you mean. That becomes more of an idiolect, your own personal language, which can be understood by only a few. That isn’t Thai.
Here is why tones are so important. The sounds of English can be divided into 3 very important parts, consonants, vowels, and intonation or stress.
If you get any of these wrong then the person listening will have trouble understanding you. For instance, let’s say we have trouble with our consonants. You want to say “your life is fine,” but you confuse the consonants and come out with “your wife is mine”, only two small consonant changes. But if you say this to the wrong person you will quickly see how important consonants are in English. In this case we say that the change in consonants is “morphemic”, it changes the word’s meaning. I don’t think that anyone would say that it is unimportant to learn the English consonants and vowels. Then why do some people insist that Thai tones are not essential to being able to speak and be understood?
 ?
? - A lesson structure to help you effectively learn Thai
- Thousands of Thai language lessons with lesson notes, podcasts, and quizzes
- Learn Thai on the go through their mobile application
- Personalized program to learn exactly on what you need
- Affordable price starting at only $8 a month
- 60-day moneyback guarantee
In Thai, tones are just as important as consonants and vowels. Changes in Thai tones cause “morphemic” changes in the words just as changes in consonants and vowels do. They mean something different. If one speaks toneless Thai it is the same as saying all English words using only one consonant. “Your life is fine.” becomes “tour tife is tine”.
And for those who advocate just saying an approximation of the Thai word and letting the Thais figure it out through its context. Don’t expect a Thai to understand a toneless Thai sentence just by using context. Would context help you understand “tour tife is tine”?
Understand Tone Rules
There are tone rules that can help you understand the tone of each word. It’s a good idea to have some understanding about it. But you do not need to remember all of them. There are those who can speak Thai correctly and can’t remember tone rules at all.
Tones and Consonants
Thai Tones are directly related to consonants as follows:
- mid class consonants can produce all five tones. There are 9 mid class consonants: ก จ ฎ ฏ ด ต บ ป อ
- high class consonants can product 3 tones: low tone, falling tone, and rising tone. There are 11 high class consonants: ข ฃ ฉ ฐ ถ ผ ฝ ศ ษ ส ห
- low class consonants can pronounce 3 tones: mid tone, falling tone, and high tone. There are 24 low class consonants: ค ฅ ฆ ง ช ซ ฌ ญ ฑ ฒ ณ ท ธ น พ ฟ ภ ม ย ร ล ว ฬ ฮ
Low class consonants can be further categorized into
- low class consonants have their own initial sounds, known as unpaired low-class consonants. They are 10 of them: ง ญ ณ น ม ย ร ล ว ฬ
- low class consonants that have initial sounds the same as high class consonants. There are 14 of them: ค ฅ ฆ ช ซ ฌ ฑ ฒ ท ธ พ ฟ ภ ฮ
Tone Marks
There are four tone marks, which will be placed above the consonants to let you know which tone you should pronounce:
- -่ (may eek): normally indicates a low tone
- -้ (may tho): normally indicated a falling tone
- -๊ (may tee): normally indicates a high tone
- -๋ (may jad ta waa) : normally indicates a rising tone
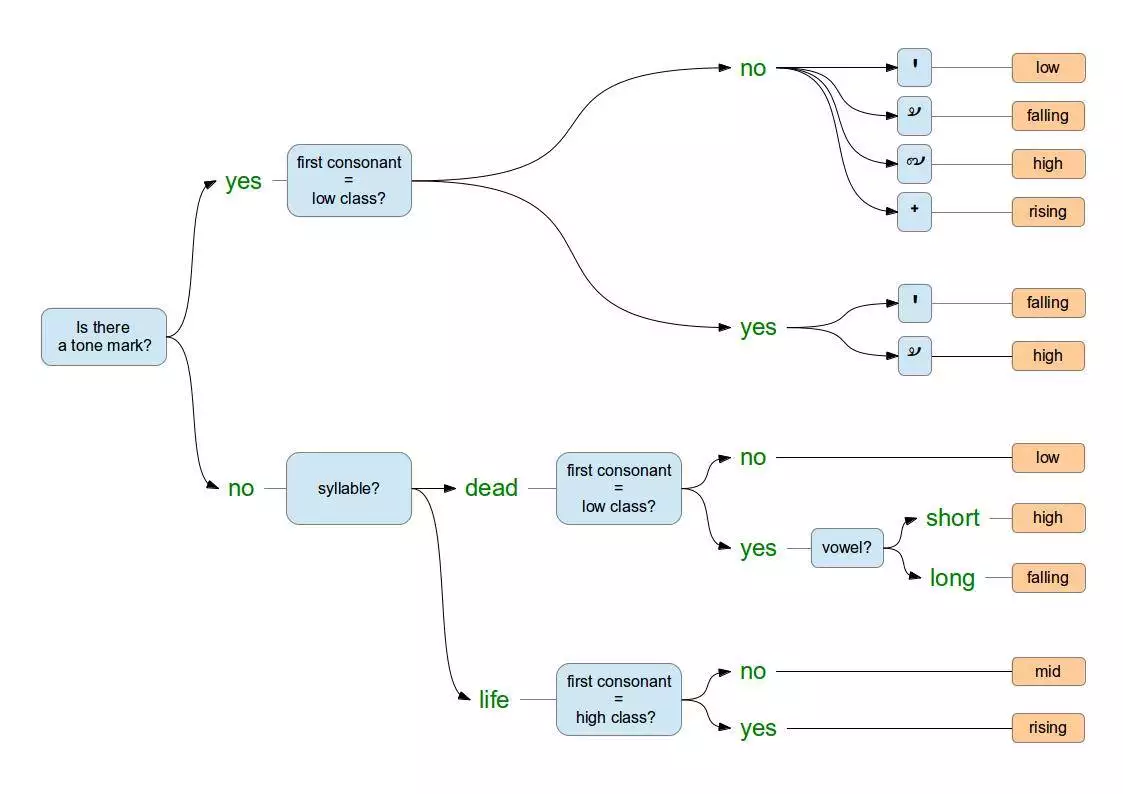
Tones can be changed based on the class consonants. Look at the chart below.
Chart of the Thai Tone Rules
Tone Patterns
To pronounce Thai tones there are some rules which depend on different classes of consonant (Mid class, High class, Low class).
Tone pattern for Low class consonant (LC)
LC (with no tone marker) + long vowel = Mid tone. For example: มา, นอน, งาน
LC (with first mark “may eek” ) + long vowel = Falling tone. For example: ค่า, ที่, พ่อ
LC (with second mark “may tho” ) + long vowel = High tone. For example: ช้า, ร้อย, ล้อ
Tone pattern for Mid class consonant (MC)
MC (with no tone marker) + long vowel = Mid tone. For example: ตา, ดู, เอา
MC (with first mark “may eek” ) + long vowel = Low tone. For example: เก่า, ป่า, ไก่
MC (with second mark “may tho” ) + long vowel = Falling tone. For example: ต้อง, อ้วน, แก้ว
MC (with third mark “may tee” ) + long vowel = High tone. For example: เก๊, เกี๊ยว, แก๊ง
MC (with forth mark “may jad ta waa” ) + long vowel = Rising tone. For example: ตั๋ว, เดี๋ยว, จ๋า
Tone pattern for High class consonant (HC)
HC (with no tone marker) + long vowel = Rising tone. For example: ถาม, เขียว, หัว
HC (with first mark “may eek” ) + long vowel = Low tone. For example: ข่าว, สี่, เสื่อ
HC (with second mark “may tho” ) + long vowel = Falling tone. For example: เสื้อ, ห้อง, ถ้วย
Tone pattern for ห + Unpaired Low-class consonants (LC)
Unpaired Low-class consonants are ง ญ ณ น ม ย ร ล ว ฬ
(A low class consonants which it’s initial sound is not the same with high class consonants)
ห + LC (with no tone marker) + long vowel = Rising tone. For example: หนี, หมอ, หลาย
ห + LC (with first mark “may eek” ) + long vowel = Low tone. For example: หล่อ, หมื่น, ไหล่
ห + LC (with second mark “may tho” ) + long vowel = Falling tone. For example: หน้า, เหล้า, ไหม้
Tone pattern with dead syllables with long vowels
MC / HC + long vowel + Dead Syllable = Low tone. For example: กอด, สูบ, ขีด
LC + long vowel + Dead Syllable = Falling tone. For example: ชอบ, โชค, ภาพ
*There’s no tone mark for dead syllables with long vowels.
Tone pattern with short vowels
MC / HC + short vowel = Low tone. For example: เตะ, แกะ, เสาะ
LC + short vowel = High tone. For example: นะ, แพะ, เลอะ
*There’s no tone mark for short vowels.
Simple Rules of Thai Tones
There are 15 possible scenarios of tone rules. But you really only need to memorize only a handful.
High and Rising tone markers will always produce high and rising tones, respectively. So you do NOT need to worry about them, or memorize anything. If you see them, you know the tone no matter what.
So now that leaves only Low and Falling tone markers to worry about. Low and Falling tone markers will always create Low and Falling tones respectively, except when they appear with… LOW CLASS.
I will count this as the first two tone rules you have to memorize, even though you only need to memorize only low class consonants.
[So Low Class with Low Tone Marker creates Falling tone (for example: ค่า, ที่), and Low Class with Falling Marker creates High tone (for example: ค้า, แล้ว)]
Now that we’ve covered the tone markers, it leaves us with what to do in the absence of tone markers.
Live Syllables and Dead Syllables
Live Syllables and Dead Syllables are easy to distinguish.
If a syllable ends abruptly, we refer to this as a “Dead Syllable”
(Final sound k /d / b ) (ก, ด, บ, ข, ค, ฆ, ฐ, ถ, ศ, ษ, ส, จ, ช, ซ, ฌ, ฎ, ฏ, ต, ป, ฑ, ฒ, ท, ธ, พ, ฟ, ภ)
If a syllable resonates longer, we refer to it as a “Live Syllable” (น,ณ,ญ, ร, ล, ฬ, ม, ง, ว, ย )
If you assume all dead syllables with no tone markers create a low tone (for example: กบ, จัด ), you then only need to worry about dead syllables with short or long vowels when they’re….You guessed it: LOW CLASS.
[Low Class Dead Short Vowel is High tone (for example: มด, รัก ), and Low Class Long Vowel is Falling tone (for example: มาก, แลก )]
So now, with only memorizing LOW CLASS consonants, you have already learned 12 of the 15 tone scenarios.
That leaves us with only Live Syllables with no tone markers. If you assume all Live Syllables with no tone markers create a Mid tone (for example: รวย, ชาม), you’ll probably be correct most of the time.
High Class Live Syllables create a Rising Tone
The only rule you need to remember is that High Class Live Syllables create a Rising tone. (for example: สวย, หอม)
So with only memorizing Low Class Consonants, and realizing their rules change with Low Tone and Falling Tone Markers, you’ve almost mastered all the rules.
Then you just realize that a High Class Live Syllable creates a rising tone, you’ve finished all the rules.
It’s worthy to point out that you never need to memorize Mid Class consonants, as when live, they’re Mid tone (for example: กาว, จาน), when dead, they’re Low tone (for example: ปาก, เด็ก)
And you only need to memorize High Class for the purpose of the absence of tone markers.
It’s really the Low Class you need to memorize as Low Tone Marker changes it’s sound to Falling tone (for example: พี่, พ่อ), and Falling Tone Marker changes it to High tone (for example:ม้า ,ซ้ำ).
And of course with no Tone Marker, Dead Short Vowels are High Tones (for example: วัด, คิด) and Dead Long Vowels are Falling Tones. (for example: วาด, รีบ) That’s a total of what? Five rules you need!?
That’s basically only memorizing five things, and (providing you can create the correct tones, with the correct vowel/consonant sounds) you’re on your way to mastering reading/speaking Thai!
With all that said, I encourage reading (especially the Manee books with audio method) and just trying to assimilate these “rules” in actual situations. Then use these simple five rules for reminders and verification.
Improving Your Thai Tone
English is full of tones that we may not be aware of. Hearing and saying them will give us an understanding that we can really differentiate and say these tones (approximations to Thai though they may be).
We can practice these sounds and after we understand how our voice mechanisms make them. We can then try them out on real Thai words.
We just use them for different things. Plain and simple, in Thai the tones are used to delineate words, use a different tone, get a different word. However, in English we use tones to carry emotive value.
No one, not even Stephen Hawking (who speaks thru a computer generated voice), speaks English without using tones. It’d be a very robotic and flat language if we did.
Mid Tone
This is a normal tone and pitch in spoken English. Not much more needs to be said, other than it’s how we speak most of the time.
You would think this might be the easiest tone for non-native speakers to replicate in Thai, seeing as it’s said in the normal tone of your voice. Sadly, this is not the case.
Without thinking, native English speakers tend to inflect word endings with subtle changes in tone.
Most people need to practice pronouncing a mid tone Thai word with a long vowel and a live ending correctly, because in English we automatically change the ending sound.
Low Tone
This tone is used in English typically for non-committal types of single word answers.
Your wife asks you to take out the garbage while you’re watching football. You answer “sure”, but in a lower tone than your normal voice. It conveys that you got what she said but you’re not gonna jump up and take out the trash this second.
This tone is used a lot in English for statements where there’s an understanding of what was being said, but the reply shows no commitment either for or against.
In Thai, this is a tone you can pretty much give a pass to as I’ve found it can sound a lot like a middle tone in spoken Thai without loss in understanding.
The sound that we say a clock makes is “tick-tock”. The second word in this expression is usually a low tone.
You can also hear the low tone in the term we use to say the sound that a horse makes when it walks, “clip-clop” or “clippety-clop”.
A Summer Song, by Chad and Jeremy
The final word in each verse of A Summer Song is a low tone:
As we walked by
Just you and I
In the starry sky
And there is a great falling tone in the last word of the bridge in “wish you didn’t have to go – no no no no”. And interestingly enough the Thai word for “no” is also a falling tone ไม่ /mâi/.
Falling Tone
This is a tone we use in English to express regret, or sympathy with something that’s said to us. A friend says his dog was hit by a car and the reply is, “Ohhh, is it okay?” That first word, “Ohhh” is said with a falling tone and conveys your sympathy to the speaker in just that single falling toned word. This tone in Thai is a critical one to wrap your head around. You should practice the falling toned Thai words used in daily dialogs
In answer to the question “how are you traveling?” You can answer, “I’m flying.” with the emphasis on how you will be traveling. The word “flying” here will usually contain a falling tone.
Go to Google Translate, choose English for the first box, enter “I’m flying” and click on the speaker icon at the bottom of the box. You’ll hear a falling tone, especially in the “fly” part of the word.
A really good example of a falling tone is the exclamation “hey!” said when you want to get somebody’s attention.
It used to be very common for little children in Thailand to call out “hey you!” (two falling tones) to any foreigner they would encounter. That would be the only English they knew and there were so few foreigners around that it at least gave them a chance to practice their English.
That is one good thing about Thailand having lots more foreigners around today. You don’t hear a barrage of “hey you!” whenever you leave your house.
You can hear the falling tone in the word “hey!” in the song Somebody Done Somebody Wrong by B.J.Thomas.
Listen to how he says “hey!” He elongates the word and when it is drawn out the final “y” in “hey” pulls the sound down making for the falling tone.
It’s the same with the word “play”.
High Tone
This tone is a little trickier to explain on how we use it in English, but we most definitely do. The reason it’s trickier is that the high tone in Thai starts at a pitch higher than your normal spoken voice and then goes up even higher from there.
In English it’s used to express surprise, shock, mild outrage or a degree of incredulity when speaking. Someone says, “hey man your car just got backed into in the parking lot”. Your response is, “what!?” The word starts high and goes even higher on the ending. It’s my experience that this and the low tone are possibly the least critical of the tones to master in Thai, and they can be blurred in spoken Thai with little loss of comprehension.
The onomatopoeic English word “hiccup” which sounds like what it describes is usually said with a high tone on the first syllable and a low tone on the second.
Rising Tone
This tone is used when asking questions in English. It is especially evident on single word questions, “what?” or “right?”. I’m sure this is why most foreigners don’t have problems replicating this tone when using the question word ไหม seeing as it’s also (by blind luck) a rising tone.
You must use this tone correctly when you’re speakin’ Thai to Thais as they exhibit very little forgiveness in foreigners getting this tone wrong. Again, I suggest you go thru words in daily dialogs that use this tone. Work on getting it to sound right. Speaking rising tone Thai words with another tone is something which can send you off script faster than you would even believe possible.
If we have a friend who is afraid of flying and he says he is going to fly anyway, you may ask him incredulously “are you really flying?”
Go back to Google Translate, choose English for the first box as before, enter “are you really flying?” and make sure to keep the ?, then click on the speaker icon. Now the word flying has a rising tone, especially on the “ing” part of the word.
Many onomatopoetic English words, that is words which sounds like what they describe, keep their tones so as to keep the word sounding like the things or activities that they are depicting.
As you can see, just from the few examples I gave – and I’m sure any native English speaker can think up a lot more – we most certainly do routinely replicate ALL five of the Thai tones without much thought.
How to Get Tones Right?
Our advice on getting tones right is to listen to how a native speaker of Thai says a word and then repeat it exactly as they say it. It is the difference between people who have perfect pitch and can sight read the music of a song and the rest of us. Some people can sing a song right from the sheet music.
But most of us need to hear it banged out on a piano first before singing the notes correctly. So reading is a great way to know what the tone of a word is, but it is not the best way to say a Thai tone correctly. Listening and repeating is how it’s done. That’s exactly how all Thai children learn to speak in tones – long before they learn how to read.
Thai Tones Stumbling Block
The huge stumbling block we have as native English speakers trying to speak Thai is that we vary the intonation of Thai words like we do when we speak English.
It’s a deal-breaker from word one because you can’t vary how a Thai word is toned and still have it be the same word. That’s the reason Thais have ending particles (I think there’s more than 50).
They are the tag words Thais use to add emotive value to what’s being said. They can change the meaning from speculative, interrogative, urging, questioning, etc.
Improving Tone with Humming
If you have trouble with tones try this. Listen to what the Thai person is saying and then try to hum it back, without using words, just a hum. The words, with their meanings, consonants, and vowels, won’t get in your way. All you will hear is the “music” of Thai. Those are the tones. After humming the sentence next try adding the words. Don’t forget to use the same music as before. This works whether we are learning Thai or English or any language. All languages have their own music.